


Exploring Nanomechanical Properties of Materials with Atomic Force Microscopy
Application Note 085 (pdf 5.3 Mb)
- Force effects in Atomic Force Microscopy imaging and spectroscopy
- Contact resonance, phase imaging, dissipation, and bimodal excitation
- Quantitative Atomic Force Microscopy - based nanoindentation
Sergei Magonov, NT-MDT Development
Different aspects of probing local mechanical interactions in Atomic Force Microscopy (AFM) will be discussed and demonstrated in this application note, using the practical examples obtained with the NEXT scanning probe microscope. The critical areas of study include the use of tip-sample force interactions in various modes for compositional imaging of heterogeneous materials and the quantitative examination of mechanical properties at small scales down to a few nanometers.
The application note consists of an introduction, three parts, which describe the force measurements in contact mode, in amplitude modulation (AM) mode, and in AFM-based nanoindentation, and, finally, the conclusions. The experimental data are supported by their theoretical analysis, which is based on the description of the tip-sample interactions using the Euler-Bernoulli equation and the asymptotic solutions of the oscillatory tip behavior during its interactions with a sample.
INTRODUCTION
Atomic force microscopy (AFM) was introduced to perform high-resolution imaging of surfaces for a broad range of materials [1]. Initially, this function was realized using a microfabricated cantilever with a sharp tip that scans a sample surface in contact mode. The force interactions between the probe and the sample are monitored by the deflection of the cantilever, and they are applied for profiling surface corrugations. Measurements of the tip-sample force interactions and their understanding become essential for the optimization of surface imaging [2] and, furthermore, for studies of local mechanical properties of materials [3]. Minimization of normal and lateral tip forces reduces the damage to soft samples and lowers the tip-sample contact area thus facilitating the high-resolution broadened AFM applications. The extreme force sensitivity of this technique has inspired a large number of deformation studies, in which pulling the probe, whose apex has been modified to stick to the sample surface, can stretch individual macromolecules. In addition to the unique force sensitivity, the small size of the probe was essential in performing both indentation and molecular pulling experiments at the nanoscale.
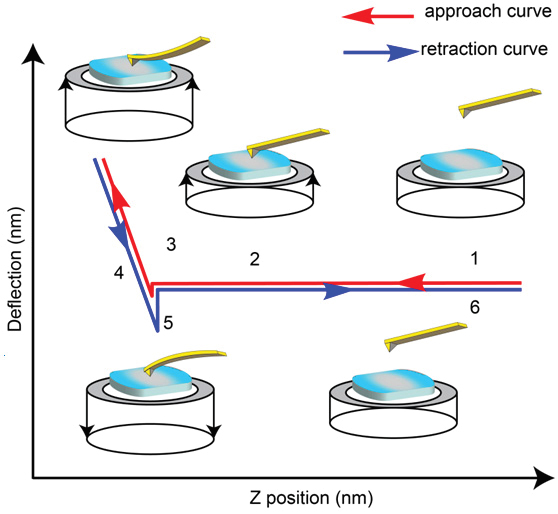
Typically, in AFM-based nanoindentation the DvZ curves are collected at rates in the 0.01‑10 Hz range, which is well below the resonant frequency of the probes. In order to expand this single point technique to mapping the surface, the force curves are collected in a mesh of points (up to 128×128 points in an operation known as Force Volume) over the examined surface area; yet this procedure is time consuming and demands low thermal drift of the microscope. The speed of this process can be dramatically increased if only few points of the DvZ curves are collected for determination of stiffness and adhesion maps. There are also a number of dynamic approaches, such as force modulation [4], contact resonance or atomic force acoustic microscopy (AFAM) [5], which can be used for exploring the local mechanical properties in contact mode. These modes are typically applied for relatively stiff samples with an elastic modulus exceeding 1 GPa. Several problems of contact mode imaging were overcome by the development of oscillatory modes (AM and frequency modulation – FM), in which the force interactions of the probe oscillating at its flexural resonance (30 kHz-1 MHz) are employed for AFM studies. Phase lag imaging, commonly call Phase Imaging in AM mode provides compositional mapping of multi-component polymer materials, which is primarily based on dissimilarities of local mechanical and adhesive properties of their constituents [6]. Although the phase contrast is efficient in differentiating the rubbery, glassy, and inorganic components of polymer blends, block copolymers, and composites, its interpretation in terms of specific mechanical properties is not feasible. We will demonstrate the peculiarities of nanomechanical analysis of force curves obtained on polymer samples with AFM-based nanoindentation, which is an extension of the studies of DvZ curves where the probe deforms a sample with different loading levels. This technique can be employed with high spatial and force resolution for local nanomechanical studies of materials. Several related examples will be discussed below. We will describe different types of nanoindentation curves and the specifics of their quantitative analysis.
TIP-SAMPLE FORCES AND NANOMECHANICAL STUDIES IN CONTACT MODE
Contact mode, which was the original
operation technique of the AFM, is
characterized by the normal and lateral
forces that act between the probe
and the sample during imaging. Ideally
the height images reflect the sample
topography best when imaging is performed
at the smallest possible force.
However in practice, this is not always
possible because capillary forces often
strongly attract the probe to the surface
and surface heterogeneities leading
to tip-sample force variations outside
the control of the feedback loop.
The force effects in contact mode can
lead to changes and irregularities in
the height images; many of these effects
have been recognized [7].
A more peculiar situation happens
with the influence of lateral forces, as
one sees from the following example.
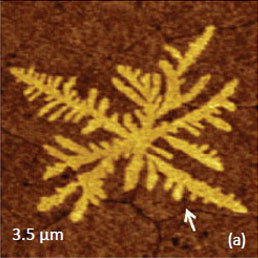
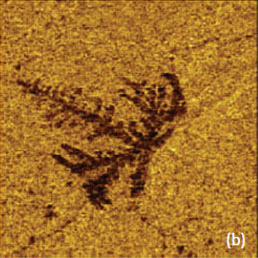
The images of a few pentacene dendritic
structures of the second adlayers
on top of a single pentacene layer on a
Si substrate are shown in Figures 2a-d.
These images were obtained using
a triangular Si3N4 probe with a spring
constant of ~0.06 N/m. The height
and lateral force images in Figures
2a-b were recorded with the probe
scanning perpendicular to the main
axis of the probe. The lateral force image
indicates that different parts of
the dendritic structures exhibit various
contrast levels compared to each
other as well as to the first pentacene
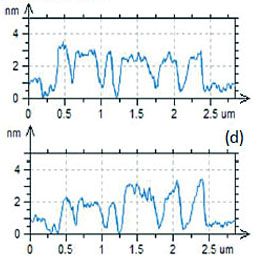
layer. As expected, the height profile
of the entire dendritic structure is at the same level of 2 nm which corresponds to the single layer
thickness of the molecules stacked with the molecular planes
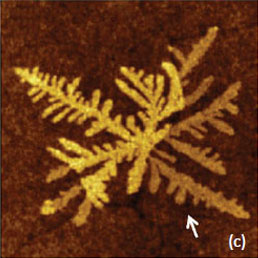
being perpendicular, Figure 2d. The height image, which is obtained
with the probe scanning along its main axis, is quite
different. Unexpectedly, part of the dendrite, which shows
lower contrast in the lateral force image, appears 1-nm lower
than the rest of the structure, Figure 2d. This effect might
originate from variations of the lateral force that cause different
degrees of probe buckling. The latter alters the apparent normal force response and therefore the related
height profile. The reason for the lateral force variations
can be different epitaxy between the parts
of the top structure and the grain structure of the
first layer that the dendrites cover [8].
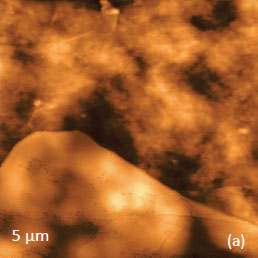
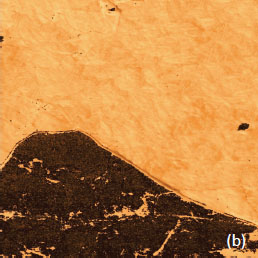
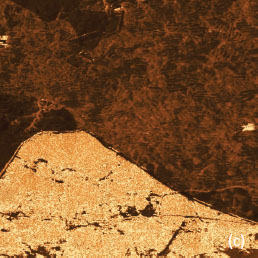
An example of the dynamic mechanical studies in the contact mode (the contact resonance technique), which were performed on a surface of high-density polyethylene partially covered with a flake of graphite, is presented in Figures 3a-c. In this contactresonance experiment a probe stays in the contact with a sample and the amplitude-versus-frequency spectrum of the probe, which is driven by a shaker, exhibits one or more contact resonances. As the probe scans over a sample surface the amplitude, phase or frequency of such resonances varies when the probe interacts with the locations of different stiffness. Basically the contact resonance shifts to higher frequency on stiffer locations. This effect is pronounced in the amplitude and phase images shown in Figures 3b-c. An edge of the graphite flake, which is recognized in the bottom part of the examined area (Figure 3a), shows the lower amplitude values and higher phase contrast as compared to the polymer in the top region. This is consistent with the fact that graphite (elastic modulus ~10 GPa) is stiffer component at this location. Furthermore, the phase image also exhibits the contrast variations on the polymer surface. This effect can be attributed to local variations of either stiffness or adhesion and it demonstrates a higher sensitivity of the phase response. A continuing interest to the contact resonance studies is also related with a possibility to explore the sample viscoelastic behavior [9] and thus to enhance the characterization of local mechanical properties of materials.
PHASE IMAGING
The introduction of oscillatory AM mode substantially
expanded AFM applications to soft materials
such as polymers and biological specimens. The
short contact time during the probe oscillation at
the cantilever resonance avoids the non-desirable,
destructive shearing of the sample common in
contact mode. The tip-sample force interactions
in AM are controlled by monitoring the amplitude
of the probe, which is driven near or at its resonance,
and by maintaining its damping at the desired
set-point level during scanning. This operation
is most common for AFM applications under ambient conditions. Control of the frequency of
the oscillating probe is performed in another oscillatory
mode – FM, which was originally applied in
UHV but recently expanded to studies in air and
under liquid.
The control of the set-point amplitude in AM mode
defines whether it operates in the non-contact or
intermittent contact regime. The latter is characterized
by an elevated level of tip-sample interactions
that gives raise to substantial phase changes
of the vibrating probe. Phase imaging is extremely
useful in studies of multicomponent polymer materials due to its high sensitivity to variations
of materials’ properties, particularly, the nanomechanical
and adhesive properties. However, interpretation
of the phase contrast is a very complex
problem. In many cases, it is impossible to establish
a direct link between the phase variation and
a corresponding variation in the chemical composition
or specific sample properties such as adhesion,
viscoelasticity, modulus, etc. Considerable
difficulties for rational interpretation of the phase
changes result from several factors: (i) the abrupt
transition (bifurcation) from an attractive force
regime to strong repulsion which acts for a short
moment of the oscillation period, (ii) nanoscopic
localization of the tip-sample interaction, (iii) nonlinear
variation of both attractive forces and mechanical
compliance in the repulsive regime, and
(iv) the interdependence of the material properties
(viscoelasticity, adhesion, friction) and scanning
parameters (amplitude, frequency, cantilever
position). The interpretation of the phase and
amplitude images becomes especially intricate for
viscoelastic polymers. Despite the all of the complications,
phase imaging is practically important
for the compositional discrimination of multicomponent
polymer materials. Several semi-empirical
correlations between the phase contrast and nature
of individual constituents in polymer and rubber
composites has been established. For example,
when imaging is performed with a stiff probe
(spring constant ~40 N/m) and elevated force conditions
(A0 = 50 nm, Asp = 20 nm) the phase contrast
changes from darkest to brightest in the following
materials sequence: fillers, plastics, butyl rubber,
EPDM rubber, styrene-butadiene rubber, butadiene
rubber, natural rubber, oil. This succession
of phase changes is valid for NEXT microscope, in
which the initial phase response changes from -90
to 90 degrees passing through zero at the probe
resonance. Practical examples of the phase imaging
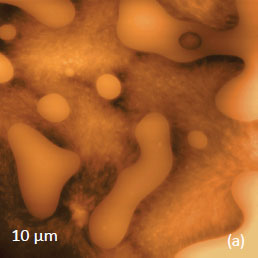
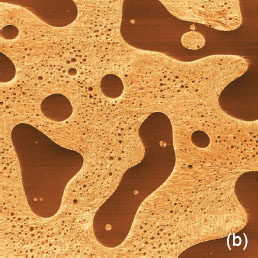
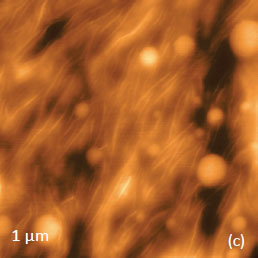
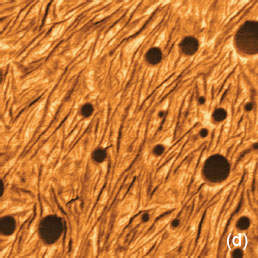
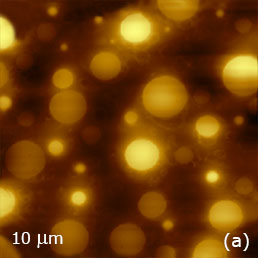
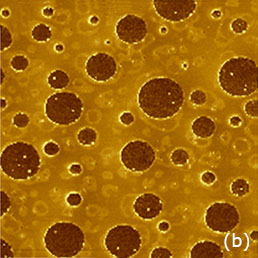
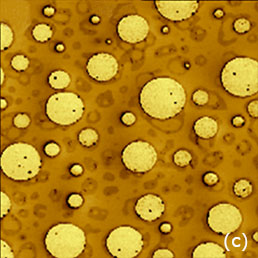
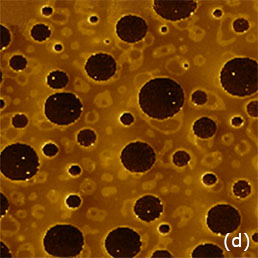
are presented in Figures 4-5. The first example is taken from studies of a film
of an immiscible blend of polystyrene (PS) and
low density polyethylene (LDPE),
Figures4a-d. Phase imaging at elevated
forces reveals the phase separation
in this blend at the microns’ and submicro
scales. In the large scale images,
Figures 4a-b, the matrix show fine
features, which can be assigned to the
lamellar structure of LDPE, the round
and extended blocks are smooth and,
therefore, can be related to amorphous
PS. This assignment is further
confirmed by the phase contrast because
a stiffer material (such as PS with
elastic modulus in the 2-3 GPa range)
typically shows a darker contrast compared
to the softer (such as LDPE with
elastic modulus in the 150-290 MPa
range). At the smaller scale, Figures
4c-d, the phase contrast clearly shows
the nanoscale domains of PS with a d iameter
in the 20-100 nm range, and
darker linear strips (~10 nm in width)
that can be assigned to the individual
LDPE lamellae embedded in the softer
amorphous matrix of this polymer.
The second example, which explores the phase imaging of a binary blend of PS with poly(butadiene) – PB with a 1:1 ratio of the components, is much more complicated. The images of this blend at different scales are shown in Figures 5a-e. On the surface of the sample, its morphology is characterized by the raised round-shaped PS blocks, which are partially immersed in the PB matrix, Figure 5a.
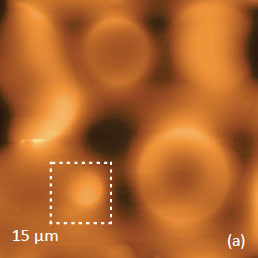
The phase images, which were recorded at low and
elevated forces (Figures 5b-c) show more heterogeneities
than expected. Besides the round-like
domains, a large flat area in between the domains
exhibits the contrast similar to that of the PS domains.
At the smaller scale, the phase image obtained
at elevated force shows features with four
different contrast levels. As we will see below,
some of these structures can be assigned to thin
layers of PS residing on the PB matrix. This example
demonstrates that the phase contrast is most
likely sensitive not only to the spatial variations of
the mechanical properties but also to the vertical
composition of the sample. Therefore, in some
cases the interpretation of phase images even of
binary materials is far from trivial. The expanded
capabilities of the NEXT microscopes, which incorporate
several lock-in amplifiers and generators,
allow studies of local mechanical properties
in different less-common modes like imaging with
the excitation at first two flexural resonances.
This approach was described in [10]. We have performed
the similar examination of the heterogeneous
polymer samples including patches of mesomorphic
poly(diethylsiloxane) - PDES, which were
spread on a Si substrate by rubbing. Such samples
were studied with AFM previously [11] and the
phase images recorded in the AM mode at elevated
tip-sample forces have clear distinguished the
substrates locations, amorphous and crystalline
parts of PDES. Furthermore, the imaging of this
sample at the 2nd flexural mode, which is ~36 times
stiffer than the 1st flexural mode, made the amorphous
polymer regions “invisible” in the height
image due to the tip penetration through the soft
material. The examination of the PDES sample using
the simultaneous drive of the probe at the 1st
and 2nd flexural modes and surface tracking at the
1st flexural mode is illustrated by height and phase
images in Figure 6. These images show the PDES
patches, which are partially covered the substrate
surfaces and aligned along the rubbing direction
from the left bottom corner to the right top corner.
A remarkable difference between the height
and phase images is that the lamellar aggregates,
which are embedded into amorphous surrounding,
are exhibit much brighter phase contrast that the amorphous polymer. The same lamellar structures
are barely seen in the height image.
A comparison of the phase images recorded in the
1st and 2nd flexural modes shows that the phase
contrast in the 2nd mode is more pronounced yet
this difference is not as strong as one reported
in [10]. The analytical consideration of the probe
behavior when it is driven at the 1st and 2nd flexural
modes shows a substantial cross-talk between
the modes. Although the double excitation brings
novel data this does not eliminate a need of a correct
model of the tip-sample interactions for the
extraction of specific mechanical properties. The
aforementioned complexity led to a strong motivation
to extend the capabilities of nanomechanical
studies beyond surface imaging. This inspired
the development of theoretical and practical approaches
to examine the dissipative and viscoelastic
behavior of polymers and other materials
on small scales. Here we will briefly consider the
theoretical analysis of the probe behavior in AM
mode. The amplitude and phase of the interacting
probe are related to the mechanical forces as the
tip approaches the sample and as the tip retreats
from the sample (Fa and Fr) as stated by the following
equations [12]:
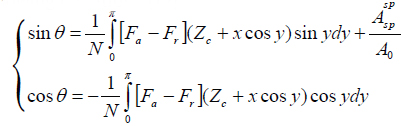
where A0 - the probe amplitude prior to its engagement into tip-sample force interactions; Zc - an averaged position of the cantilever over a surface during oscillations, and
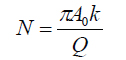
(k and Q - spring constant and quality factor of the probe at 1st flexural resonance).
The essential parts of the equations are the integrals
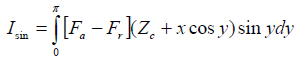
and
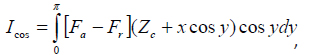
which can be connoted as the dissipative and conservation integrals, respectively. In the case of conservative forces the dissipative integral is nullified and the first equation is simplified. A pathway from oscillatory AFM measurements to the extraction of specific material properties includes the reconstruction of the tip-sample force from the probe variables (e.g. amplitude and phase) and the calculation of the specific materials properties from the force-property model or equation. As we have already shown [13], this task is achievable for local tip-sample electrostatic measurements because the latter are conservative and separable, in addition the electrostatic force/surface potential, electrostatic force/dielectric permittivity relationships can be derived and verified for various AFM tip-sample geometries with finite element analysis.
The main hurdle on the way to the extraction of specific mechanical properties from AM measurements is poor knowledge how Fa and Fr are related to the fundamental mechanical properties such as storage and loss modulus and work of adhesion. The use of conservative models such as Hertz, Sneddon, JKR and DMT can be justified only for true non-dissipative measurements, which are quite rare in AFM studies of polymers. Recently [14], there was an attempt to approach studies of the non-dissipative response of polymer samples using the ratio of the dissipative and conservative integrals as follows:
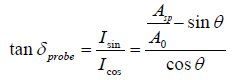
Obviously, this tanδprobe is not directly related to tanδsample, which is the ratio of loss and storage moduli determined in macroscopic dynamic mechanical measurements. Therefore, exploring the possible correlation between tanδprobe and tanδsample needs complete practical verification, which is not trivial due to many reasons including the differences in frequencies of macroscopic and nanoscale mechanical testing. With regards to the expansion of phase imaging by addition of the dissipative and tanδprobe channels, the situation does not look very promising. The relevant images of a sample of a binary PS/PB blend, in which the components’ dispersion was improved by ultrasonic agitation, are presented in Figures 7a-d. In these images, which were obtained at elevated forces (Asp = 0.5A0, A0 = 80 nm), the contrast of the phase, dissipation and tanδprobe channels looks quite similar.
AFM-BASED NANOINDENTATION
The use of DvZ curves for probing of local mechanical
properties in AFM was proposed more than 20
years ago [3]. Below we consider the essential elements
of nanomechanical studies with AFM and
present a number of illustrative examples. The extraction
of quantitative nanomechanical data from
AFM measurements is a challenging task that can
be achieved for a number of materials under the
assumptions that a researcher can accomplish a
number of requirements. The first one is related
to the characterization of the AFM probe that includes
the evaluation of the cantilever spring constant
and shape of the tip as well as detection of
the probe’s optical sensitivity on a hard surface.
The spring constant of the probe is typically determined
using its thermal excitation and the calculations
introduced by J. Sader and coworkers [15].
The shape of the tip is best estimated from electron
microscopy micrographs [16]. It can be also verified
by imaging latex spheres as shown elsewhere
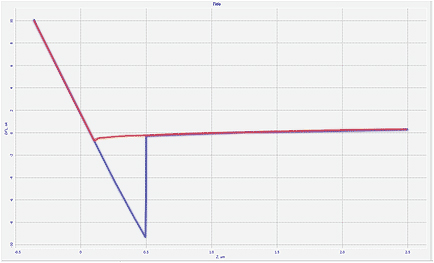
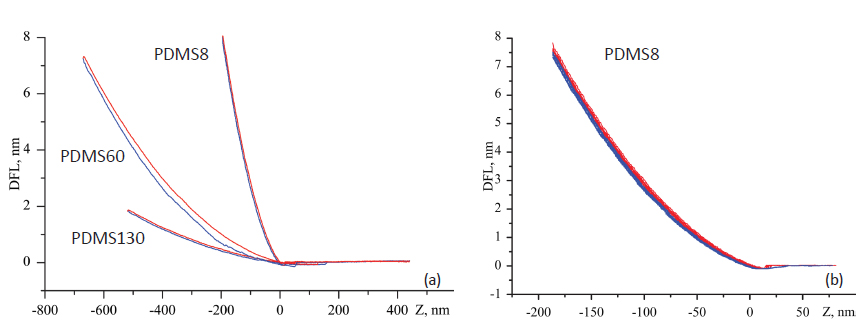
[17-18]. The conversion of DvZ data into load-versus-
penetration (PvH) curves can be accomplished
by subtraction of the slope of the calibration DvZ
curve obtained on hard substrate, such as the one
shown in Figure 1b.
Prior to AFM-based indentation, it is quite desirable
to examine the surface morphology and to choose particular locations of the sample. The imaging
is accomplished in AM mode to avoid possible
modification or damage of the tip and sample.
For homogeneous samples, indents performed in
different locations are necessary to collect sufficient
DvZ curves for averaging. For heterogeneous
materials preliminary imaging will allow indenting
the individual components or specific locations for
further comparison of their properties. It is also
important to perform the measurements at different
force levels by triggering the maximal probe
deflection. Such measurements can be invaluable
for separation of the elastic and plastic contributions
to the force curves, which will simplify their
quantitative analysis. After the force curves are
collected it is worth re-examining the same locations
to visualize the possible indents left and to
measure their shapes and dimensions.
The additional information, such as visualization
of the possible pile-ups around the indents, will
be invaluable in the analysis of the local mechanical
properties. Finally, one should choose the appropriate
deformation model for data analysis
and extraction of the elastic modulus and work
of adhesion. Unfortunately, most of the indentation
data are analyzed with the conservative solid
deformation models (Hertz, Sneddon, JKR, DMT)
that discard the time-dependent (viscoelastic) effects.
In some instances it can be wise to record
the force curves at different rates or to follow an
indents’ recovery by continuous imaging in order
to determine if such effects are present. The practical
examples, which illustrate the methodology of AFM-based nanoindentation, were obtained on
several polymer materials with the elastic modulus
in the 600 kPa – 3 GPa range.
The polymer samples include ~1 mm thick blocks
of polystyrene (PS), polycarbonate (PC), Nylon 6,
linear low-density polyethylene (LDPE), a blend
of PS and PB, and the described earlier 4 μm-thick
films of semiconductor dielectric resin SiLK™ [16]
and polydimethylsiloxanes (Dow Corning) with different
degree of polymerization between crosslinks
(PDMS8, PDMS60 and PDMS130) on Si substrate
[17]. These measurements were performed
with a Si probe, which has a spring constant of 42.5 N/m. The tip radius, which was estimated on a latex
sample [18, 19], is approximately 33 nm, which
is close to the radius size (30 nm) given by the
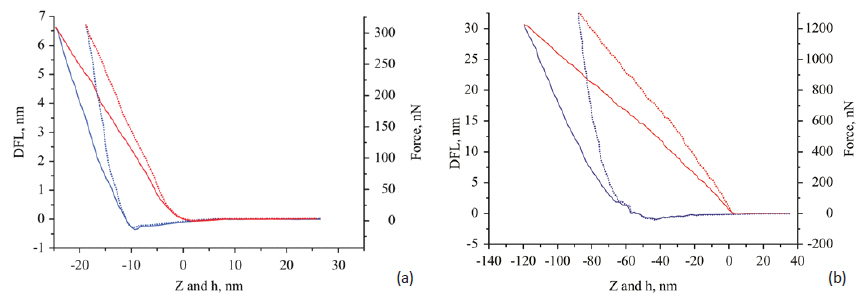
probe manufacturer. Typical DvZ curves recorded
on rubbery samples are shown in Figures 8a-b. The
approach and retreat curves obtained on rubbery
samples of PDMS8 and PDMS130 are practically
identical, and this is direct evidence of complete
recovery of the sample deformation. These curves
were practically the same at low and high loads.
The force curves, which were recorded in 9 different
locations, show remarkable consistency. Prior
to the analysis of these curves they have been
transformed into FvH plots, which are not much
different from the DvZ plots for soft materials. Due
to the conservative character of the deformation,
the analysis of the force curves of PDMS8, PDMS60
and PDMS130 samples can be performed using the
elasto-adhesive JKR model.
| Polymer Material | Elastic Modulus | Work of Adhesion | ||
| Macro | AFM | Macro | AFM | |
| PDMS-8 | 13.4 Mpa | 13.9 Mpa | 49 J/m2 | 32 J/m2 |
| PDMS-60 | 1.61 Mpa | 1.74 Mpa | 58 J/m2 | 52.2 J/m2 |
| PDMS-130 | 0.74 Mpa | 0.66 Mpa | 47-58 J/m2 | 42.1 J/m2 |
This is one of the models, which are implemented in our LabVIEW-based analysis program that was applied for the treatment of the force curves described in this note. The elastic modulus and work of adhesion data for three rubbery samples are presented in Table 1 together with the results of the macroscopic studies [18]. A comparison of these data shows a good quantitative match between elastic moduli and work of adhesion, which were obtained in the macroscopic measurements and AFM-based nanoindentation results. These findings are consistent with the earlier observations [17, 20]. The next group of polymer samples includes PS, PC and SiLK – the amorphous materials, which are in the glassy state at room temperature, and semicrystalline LDPE and Nylon 6. We will use the force curves (DvZ and FvH) obtained on PS at different loads as a representative case, Figures 9a-b.
In the contrast to the force curves of the rubber samples, the DvZ plots obtained on PS show the discrepancies between the approach (loading) and retreat (unloading) traces, which become more pronounced at high load. This behavior points out a dissipative deformation process and makes challenging the extraction of the quantitative mechanical properties. One of the problems of the analysis is proper choice of either a loading or unloading parts of the force curves. From one side, an initial part of the loading curve, which is often used in macroscopic experiments for an extraction of elastic modulus, in AFM measurement might be influenced by surface roughness effects or surface contamination. From the other side, the use of high loads might cause a change of polymer material under the probe and, therefore, the modulus will be estimated for the deformed material. Therefore, the use of moderate loads might be optimal for AFM-based nanoindentation experiments. This suggestion is justified by the results of analysis of the FvH curves of PS, PC, LDPE and SiLK samples, which were recorded at different loads. In this analysis we neglected the dissipative character of such curves and treated them in terms of Hertz model.
The elastic moduli of the materials calculated from the force curves and, particularly, at the beginning of the unloading trace in cases of moderate loads, show a reasonable correlation with the elastic modulus values recorded in macroscopic mechanical measurements, Table 2. When the load is increased the dissipative character of the curves becomes more pronounced and this might be one reason that the use of the solid state deformation models, which do not account for materials plasticity and viscoelasticity, does not usually provide rational results. In many cases, however, the analysis of FvH curves obtained at high loads showed reasonable elastic moduli when the unloading traces were treated in terms of Sneddon model with plastic correlation [16].
| Polymer Material | Elastic Modulus | |
| Macro | Macro | |
| LDPE | 152-290 Mpa | 204 Mpa |
| PC | 1.79-3.24 Gpa | 2.30 Gpa |
| PS | 3.0-3.5 Gpa | 2.99 Gpa |
| SILK | 2.45 Gpa | 2.25 Gpa |
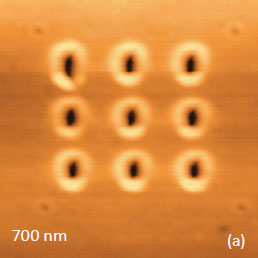
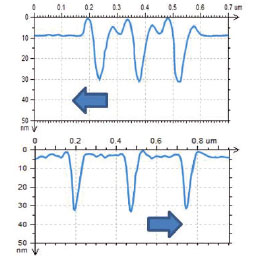
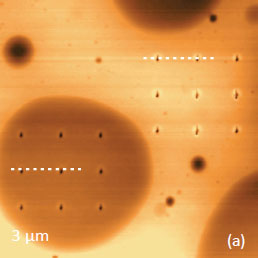
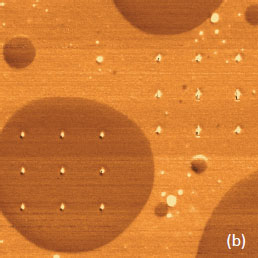
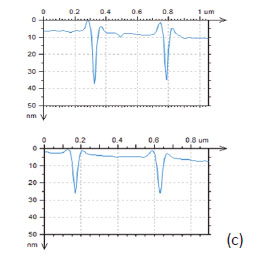
The important feature of AFM-based nanoindentation is that the indented locations can be visualized with high special resolution in the resultant images. The surface areas of PS, PC, SiLK and HDPE with the indentation marks, which we left by the AFM probe that deformed the samples with ~3 μN load, are shown in Figures 10a-d. The cross-section profiles, which were drawn in the vertical direction along the central row of the indents, are shown together with the height images. One can notice that high pileups are formed around the indents left in PS sample due to its plasticity, and they are practically absent in case of LDPE. Regarding the indent depth, it is the largest for the softer LDPE and the smallest for SiLK. The latter fact indicates a fast recovery of tip-induced deformation in this dielectric resin. Therefore, time-dependent effects should be taken into consideration during analysis of mechanical response of SiLK sample.
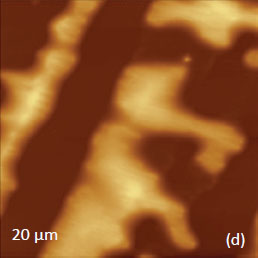
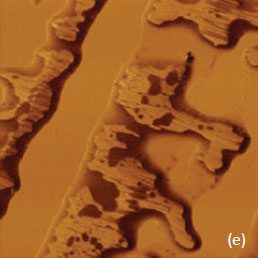
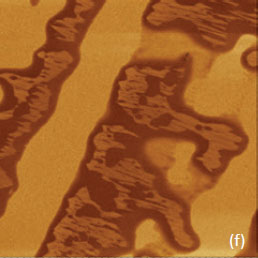
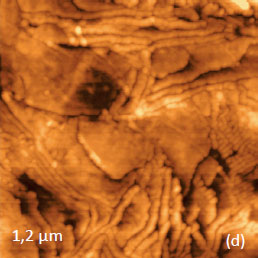
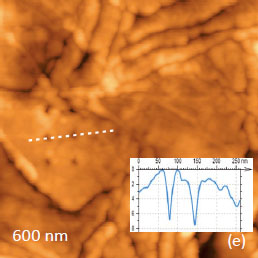
The comparison of the indents made in different polymers shows that we can learn much about local mechanical properties of polymers in addition to the measurements of elastic modulus and adhesion. This statement is further s upported b y the indenting results, which were obtained a surface of an ultrathin film of a binary blend of PS and poly(vinyl acetate) - PVAC, Figures11a-b, and on lamellar structure of high-density polyethylene (HDPE), Figures 11c-d. Two grids of 9 indents are seen on the round-shape domain of PVAC and surrounding matrix of PS. Although, at room temperature these components are in glassy state and elastic modulus of PS is slightly larger than that of PVAC the phase image shows a darker contrast on the PVAC domains.
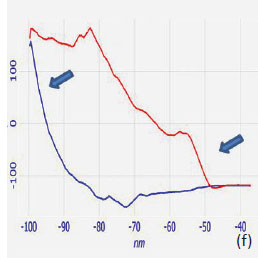
The contrast is difficult to interpret because of an additional complication related to the fact that a rigid substrate might influence the local thicknessof such 70-nm thick film. A comparison of the indents appearance and the cross-sections, which are presented in Figure 10c, points out that the matrix material is more plastic whereas the PVAC indents are smaller most likely due to their faster recovery. Another example is taken from studies of HDPE sample, whose surface exhibits developed lamellar structures with the individual lamellae being flat or edge-on oriented, Figure 11d. Several indents were made on flat-lying lamellae, and the remaining indents of 6-7 nm in depth are shown in Figure 11e. These values are close to the thickness of individual lamellae that was most likely penetrated by the tip. The loading and unloading traces recorded during the indenting of the lamellae (Figure 11f) are rather complicated. At the beginning of the loading path, which is indicated with a blue arrow, the deformation is elastic and it transforms into a small plastic part before climbing further. The initial deformation is quite similar to one that was reported in the indenting of the flat lamellae of the ultra-long alkane C390H782 [21]. The unloading portion looks more typical for deformation of semicrystalline polymers. The estimates of the elastic modulus for the loading and unloading paths in the regions indicated with the arrows showed that the elastic modulus of the initial deformation at least 50% higher. This can be expected because the polymer chains are oriented vertically in the flatlying lamellae and exhibit higher modulus compared to the bulk material with random orientation of polymer molecules. This example demonstrates the unique ability of AFM in studies of mechanical properties of the confined nanostructures.
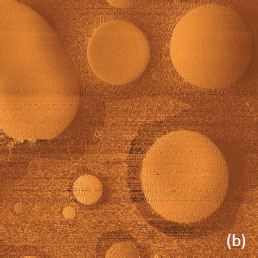
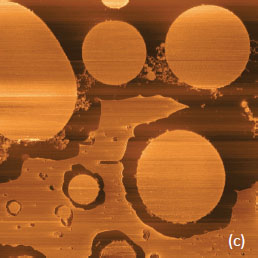
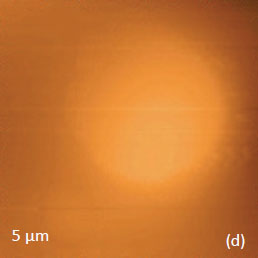
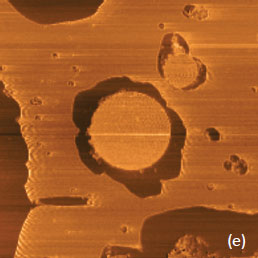
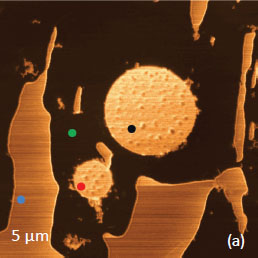
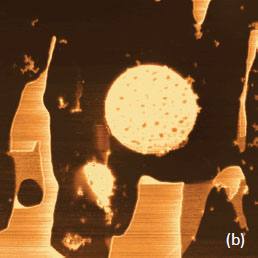
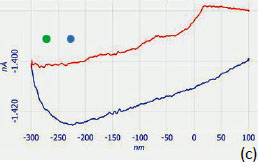
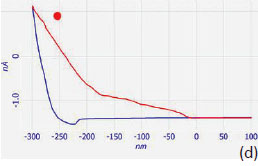
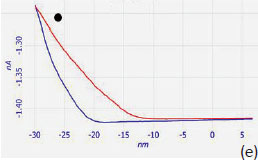
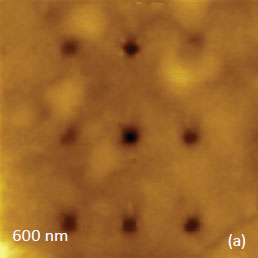
The variety of 2D and 3D morphologies of polymer materials is enormous and some of them are nontrivial for characterization. Even in binary blends their constituents can appear in structures of different size and shape as shown in phase image of PS/PB blend, Figure 12a. As we learned earlier (see the description of Figures 5), the bright domains of the phase image can be assigned to PS structures embedded into PB matrix. Several locations, which are marked with small circles of different colors, were chosen for the indentation experiments, and the phase image obtained after the experiments is presented in Figure 12b. Surprisingly, the DvZ curves obtained at the “blue” and “green” locations, which are assigned to PS and PB materials, are the same, Figure 12c. The loading and unloading paths show mostly strong adhesion.
The phase image in Figure 12b, which shows a circle of PB at the former “blue” location, allows us to suggest that the PS domain was quite thin and was destroyed by the tip, which was attracted to the sample because of its relatively large size. The DvZ curves, which were obtained at small and large round-shaped islands of PS, have different shapes, Figures 12d-e. The curve obtained on the small island has two stages (Figure 12d) and this might correlate with a partial damage of the island as seen from the phase image in Figure 12b. The curve, which was collected on the black-colored location of the big island, looks common to those collected on the blocks of PS and other amorphous polymers. This example of the sample complexity shows that a comprehensive study of multicomponent materials can be quite difficult and likely requires the interplay between different methods and approaches.
Height
DvZ
DvZ
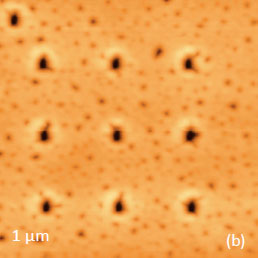
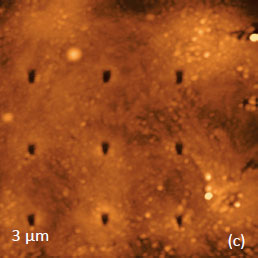
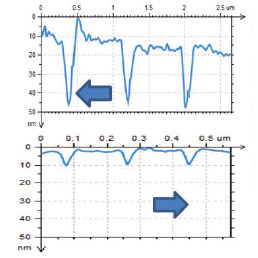
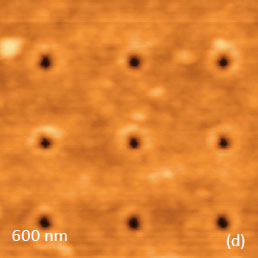
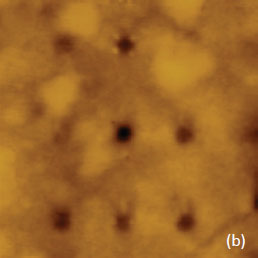
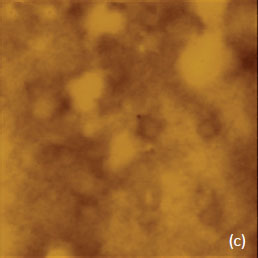
In further development of the nanoscale mechanical measurements with AFM techniques there is a novel trend in data analysis - a transition from non-dissipative models to more sophisticated approaches accounting for viscoelasticity effects. As we mentioned before, the time-dependent effects strongly manifest themselves in the recovery of the indents [22-23]. This effect is illustrated by imaging of the indents, which were left on a surface of a block prepared from a binary blend of polyethylenes with different degree of octene branching. The constituents of the blend have different densities (0.92 g/cm-3 and 0.86 g/cm-3) and crystallinity. The surface of the sample is enriched in low-density material and does not show lamellar morphology. The sub-surface morphology might be very different and can exhibit itself in the nanoindentation experiments, and particularly, in the indent recovery pattern. This is demonstrated in the height images and the related graph in Figures 13a-d. The first two images were recorded 5 and 20 minutes after the indentation experiment, in which a grid of 9 surface imprints was made. The imprints disappeared slowly and became almost invisible in the height image (Figure 13c), which was recorded 10 hours after the image in Figure 13b. The analysis of the images shows the different recovery kinetics for the imprints, with the slowest for the indent in the center, Figure 13d.
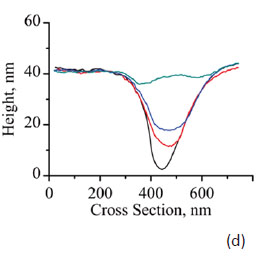
The time changes of the imprint profile hint at the affine character of the recovery similar to the finding in the experiments on styrene-butadiene copolymers [24]. In the same paper, it was shown that the depth of the imprint follows the variations of the corresponding homogeneous creep-recovery experiment. Therefore, by imaging the imprint one can obtain the variations of the polymer compliance function. This example shows that local mechanical properties of polymers and other materials can be examined in different AFM-based experiments with the choice of the most appropriate mode.
CONCLUSIONS
The tip-force mechanical interactions are the core of AFM and they manifest themselves in different modes and operation conditions. Therefore, knowledge of the tip-force effects is indispensable for the correct interpretation of AFM data and for their use for the exploring local mechanical properties of materials.
Several techniques for probing of sample’s stiffness and adhesion were illustrated on practical examples obtained with the NEXT microscope, which is equipped with most of the common modes for studies of mechanical properties. The differences in mechanical properties of the materials are employed for compositional imaging of multi-component samples in contact resonance mode and for phase imaging in AM mode. AFM nanoindentation is a technique that provides the local nanomechanical data that for some polymer materials can be used for extracting the quantitative elastic modulus and work of adhesion. However, broader acceptance of this method is limited by the restrictions for the solid-state, non-dissipative models used for data analysis. Several time-dependent effects in local mechanical studies were presented to underline the need for their serious consideration. A development of novel models accounting the plastic and viscoelastic behavior of polymersis essential for the further progress of AFM nanomechanical studies.
REFERENCES
1. G. Binnig, C. F. Quate, and Ch. Gerber “Atomic force microscope”
Phys. Rev. Lett. 1986, 56, 930–933.
2. A. L. Weisenhorn, P. Maivald, H.-J. Butt, and P. K. Hansma
“Measuring adhesion, attraction, and repulsion between
surfaces in liquids with an atomic force microscope” Phys.
Rev. B. 1992, 45, 11226-11232.
3. N. A. Burnham, and R. J. Colton “Measuring the nanomechanical
properties and surface forces of materials using
an atomic force microscope” J. Vac. Sci. Technol. A 1989, 7,
2906–2913.
4. P. Maivald, H. J. Butt, S. A. C. Gould, C. B. Prater, B. Drake,
J. A. Gurley, V. B. Elings, and P. K. Hansma, “Using force
modulation to image surface elasticities with the atomic
force microscope” Nanotechnology 2,
103-106, 1991.
5. U. Rabe, S. Amelio, M. K.-M. S. Hirsekorn, M. Kempf, M.
Göken, and W. Arnold “Imaging and measurement of local
mechanical material properties by atomic force acoustic
microscopy” Surf. Interface Anal. 2002, 33, 65-70.
6. S. N. Magonov “AFM in Analysis of Polymers” Encyclopedia
of Analytical Chemistry, (R. A. Meyers, Ed.), pp. 7432-
7491, John Willey & Sons Ltd, Chichester, 2000.
7. M. Bai, S. Trogisch, S. Magonov and H. Taub “Explanation
and correction of false step heights in amplitude modulation
atomic force microscopy measurements on alkane
films” Ultramicroscopy2008, 108, 946-952.
8. V. Kalihari, D. J. Ellison, G. Haugstad, and C. B. Frisbie
“Observation of unusual homoepitaxy in ultrathin layers of
pentacene films and correlation with surface electrostatic
potential” Adv. Mater. 2009, 21, 1-7.
9. P. A. Yuya, D. C. Hurley, and J. A. Turner, “Contact Resonance
Atomic Force Microscopy for Viscoelasticity” J. Appl.
Phys.2008,104, 074916-22.
10. N. F. Martinez, S. Patil, J. R. Lozano, and R. Garcia “Enhanced
compositional sensitivity in atomic force microscopy
by the excitation of the first two flexural modes” Appl.
Phys. Lett. 2006, 89, 153115-7
11. S. N. Magonov, V. Elings, and V. Papkov “AFM study of
thermotropic structural transitions of poly(diethylsiloxane)”
Polymer 1997, 38, 297-307.
12. S. Belikov, and S. Magonov “Classification of Dynamic
Atomic Force Microscopy Control Modes Based on Asymptotic
Nonlinear Mechanics” Proceedings American Control
Society, St. Louis, 979-985, 2009.
13. “Exploring materials with AFM-based electric modes” NT-MDT SI Application Note. 2012.
14. R. Proksch, and D. G. Yablon “Loss tangent imaging: Theory
and simulations of repulsive-mode tapping atomic force
microscopy” Appl. Phys. Lett. 2012, 100, 07106-07109.
15. J. E. Sader, J. W. M. Chon, and P. Mulvaney “Calibration
of rectangular atomic force microscope cantilevers” Rew.
Sci. Instrum.1999, 70, 3967-3969.
16. S. Belikov, N. Erina, L. Huang, C. Su, C. Prater, S. Magonov,
V. Ginzburg, B. McIntyre, H. Lakrout, and G. Meyers
“Parametrization of atomic force microscopy tip shape
models for quantitative nanomechanical measurements” J.
Vac. Sci. Technol. B2009, 27, 984-992.
17. S. Belikov et al “Theoretical modeling and implementation
of elastic modulus measurement at the nanoscale
using atomic force microscope” J. of Physics: Conf. Series
2007, 61, 1303-1307.
18. C. Odin, J.P. Aime, Z. El Kaakour, and T. Bouhacina “Tip’s
finite size effects on atomic force microscopy in the contact
mode: simple geometrical considerations for rapid estimation
of apex radius and tip angle based on the study of polystyrene
latex balls” Surf. Sci.1994, 317, 321-340.
19. “NEXT Scanning Probe Microscope: Visualization of Surface
Nanostructures and Morphology” 2012, NT-MDT SI Application Note 086.
20. H. Lakrout “Quantitative AFM-Based Nanoindentation
of Poly(dimethyl siloxane) Films” Proc. Of Annual Meeting
of the Adhesion Soc., 31st, 2008, pp.292-294.
21. S. Magonov “High-Resolution Visualization and Compositional
Analysis of Polymers with Atomic Force Microscopy”
Int. Journ. Polym. Analysis and Characterization,
2011,16, 508-518.
22. S. N. Magonov and D. Reneker “Characterization of Polymer
Surfaces with Atomic Force Microscopy” Annul. Revs.
Mat. Sci.1997, 175-222.
23. S. Magonov, J. Alexander, and S. Belikov “Exploring surfaces
of materials with atomic force microscopy” in “Nanoscale
applications for information and energy systems.
Nanoscience and technology” A. Korkin and D.J. Lockwood
(eds). Chapter 7, Springer, New York, 2012, in press.
24. C. Basire, and C. Fretigny “Étude locale des propriétés
d’adhésion de matériauxviscoélastiques avec un microscope
à force atomique” C. R. Acad. Sci. Paris 1997, 325,
211-220.