


Quantitative Nanomechanical Measurements in HybriD Mode Atomic Force Microscopy
Application Note 090 (pdf 1.7 Mb)
Sergei Magonov, Marko Surtchev, Sergey Belikov, Ivan Malovichko and Stanislav LeesmentNT-MDT Development Inc., Tempe, AZ 85284 USA
NT-MDT, Zelenograd, 124482 Russian Federation
- Quantitative nanomechanical measurements of polymer samples in HybriD mode showed that the local elastic moduli correlate well to their macroscopic values.
- Maps of elastic modulus were successfully applied for compositional mapping of immiscible polymer blends.
- High spatial resolution of the elastic modulus mapping was demonstrated on polymers with well defined lamellars tructures.
INTRODUCTION
Atomic Force Microscopy (AFM) has been introduced for high-resolution visualization of surface structures with the help of a micro-fabricated probe with a sharp tip. The tip-sample forces, which are used for surface profiling in different AFM modes, can be monitored and optimized with so-called force curves [1]. The most common force curve is the dependence of the cantilever deflection (D) on the tip-sample distance (Z) – DvZ. When the probe force is strong enough it can deform a sample and,
therefore, the force curves are often employed for local mechanical measurements [2]. Such measurements can be performed in a single sample location or at multiple sites covering a chosen sample area.
The analysis of these curves in a framework of different solid state deformation models provides local values of elastic modulus and work of adhesion. Quantitative nanomechanical measurements (QNM) in a relatively novel AFM mode – HybriD mode [3] are presented in this application note. We will describe the experimental routines of nanomechanical measurements, discuss theoretical approaches for calculations of mechanical properties and verify QNM on bulk samples of neat polymers, on films of immiscible polymer
blends and polymer materials with a well-defined lamellar structure.
THE EXPERIMENT IN HYBRID MODE
In contact mode and in oscillatory non-resonant modes such as HybriD mode the tip-sample forces are measured by the deflection of the cantilever. When a sample is vertically moved towards a probe, the tip comes first in the attractive and then in the repulsive force interactions with a sample. These interactions are monitored by the bending of the cantilever, which is directly proportional to the force through the cantilever spring constant. In the contact mode, the DvZ or force-versus-distance,
FvZ curve is recorded when the sample is moved vertically by a triangular voltage wave applied to the scanner with a rate in the 0.1-10 Hz range. At higher rates, a ringing at the turnaround points generates unwelcomed high-frequency responses, and this limits a fast recording of the force curves and a construction of high-density maps of mechanical properties within a reasonable time.
In HybriD mode the situation is improved because the oscillatory motion of a sample is actuated by sine voltage wave and the force curves are collected at the kHz rate. This allows real-time QNM that include the time-efficient harvesting of the force curves and their fast analysis yielding the maps of local mechanical properties practically simultaneously with the height image, which presents a surface profile.
In HybriD mode a sample is driven at 1.5 kHz rate and amplitude of these oscillations (typically 30 nm) is chosen to be high enough to embrace a complete cycle of the cantilever bending from the baseline to the baseline, Figure 1.
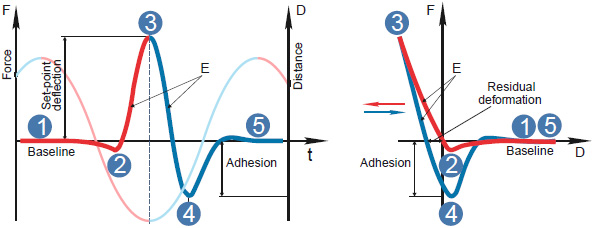
The related deflection-versus-time, Dvt or force-versus-time, Fvt curve reflects the cantilever bending in the approaching and retracting parts of the oscillatory cycle with the slopes corresponding to the tip-induced deformation and the attractive wells - to adhesion. The Dvt (Fvt) curve can be transformed to the DvZ (FvZ) curve using the sine trace of the scanner. As the solid state deformation models are applied to force-vs-deformation curves (Fvh), the latter can be obtained from the Fvt and FvZ curves using the spring constant of the probe and optical sensitivity of the microscope. These essential QNM parameters can be extracted from thermal tune procedure with the use of Sader approach [4]. In addition to the spring constant of the probe – k, a nominal radius of the tip apex (R) can be applied for analysis of the force curves in terms of Derjaguin-Muller-Toporov (DMT) model [5]. In this model the Fvh dependence is described as
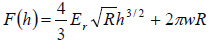
where Er – the reduced modulus of the sample and tip, and W - work of adhesion.
The modulus is related to the Dvh slope:
 where a is a contact radius derived from
The  is linked to the experimental slope
  as
as 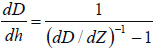
This expression can be simplified by substituting  and
and
 , then the error
  can be large as x approaches 1. To avoid this effect in studies of hard samples one should use the probes with high k that makes
  smaller than 1.
Our estimates showed that to avoid a double increase of dy compared to dx one should choose probes with k at least of 30 N/m for studies of materials with elastic modulus of 3 GPa and less; and the probes with k > 175 N/m – for materials with elastic modulus of 40 GPa. For evaluation of HybriD mode capabilities we chose neat polymers: polycarbonate (PC), low-density polyethylene (LDPE); films of binary immiscible blends of polystyrene (PS) with poly(butadiene) - PBd, LDPE, poly(methyl methacrylate)
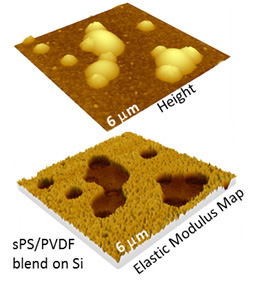
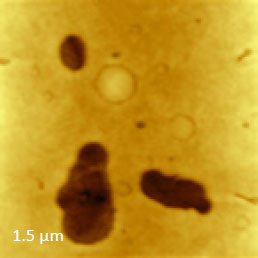
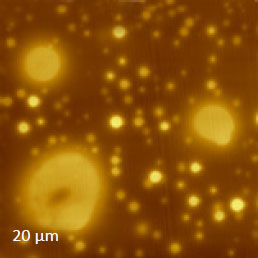
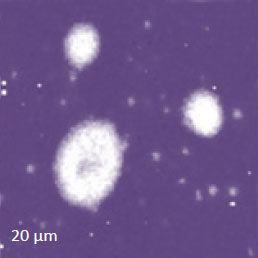
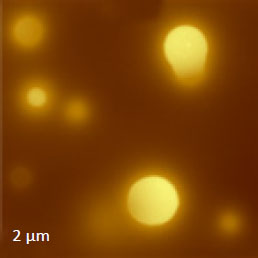
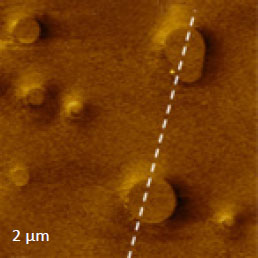
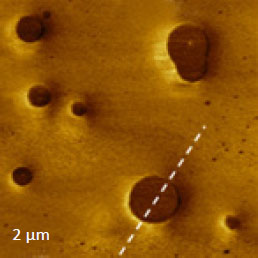
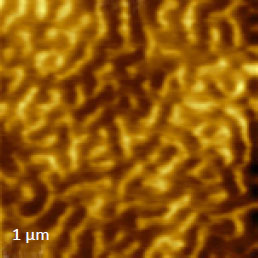
- PMMA, and polymers with well-defined lamellar morphology: high-density polyethylene (HDPE), linear low-density polyethylene (LLDPE) and block copolymers of PS-b-PMMA and PS-b-PBd-b-PS. The polymer films were thicker than 100 nm to avoid a substrate influence. The results obtained on a blend of syndiotactic PS – sPS and poly(vinyl difluoride) –PVDF, which exhibits a dewetting morphology on a Si substrate, were used for a cover picture.
Our QNM studies were conducted with the NEXT scanning probe microscope on polymer samples whose macroscopic elastic modulus was below 4 GPa. Therefore, we employed a Si probe NSG 30A with k=28.2 N/m and R=10 nm. In the experiments, we simultaneously collected height images and maps of deformation, elastic modulus and work of adhesion, all with 512x512 pixels density.
The measurements were performed in the NT‑MDT SI thermally stable cabinet, where an electronic control keeps a sample temperature constant with a precision that is better than 0.01˚C. This allows low-thermal drift (< 0.2 nm/min) studies on areas down to 100 nm on side with the scanning rates in the 0.4-1 Hz range.
It is good practice to perform the tip engagement to the sample in the amplitude modulation (AM) mode, which is characterized by the most gentle tip-sample forces. Soft approach, which is the unique feature of NT‑MDT SI microscopes, provides a probe landing, in which an initial intermittent contact is judged by the jump in the phase signal of the oscillating probe. After this happens at a particular amplitude, the AM servo can be switched off and HybriD mode can then be chosen for operation.
The on-line analysis of the elastic modulus was performed using the DMT model in two different approaches. This is one of several models: Hertz, Sneddon, Johnson-Kendall-Roberts – JKR, which are embedded in our on-line and off-line analysis software. In the first approach, the point-by-point calculations of the elastic modulus and work of adhesion are performed in a region of interest of the Fvh curve [6].
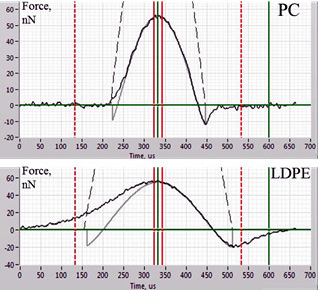
The second approach, which is less common, is based on an optimal fit of the Fvt curve or its part using the elastic modulus and work of adhesion as the fit parameters. This approach is shown in Figure 2, where the Fvt curves obtained on PC and LDPE samples with the maximal force of 55 nN are presented.
So far, most of the solid state deformation models, which are applied for the QNM analysis of AFM curves, describe the conservative deformation.
We also limit ourselves to such DMT model and a comparison of the best fit theoretical plots with the experimental curves obtained on PC and LDPE (Figure 2) shows that a deviation from the conservative case is stronger in LDPE, where the asymmetry of the experimental curves with respect to the force maximum is more pronounced than in the case of PC. Therefore, we confined the analysis to the retracting part of the force curves, and the data reported below were received in such approximation. Our analysis is restricted
to the elastic modulus data. The work of adhesion for different polymers will be analyzed separately.
QNM STUDIES OF NEAT POLYMERS
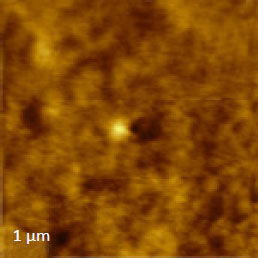
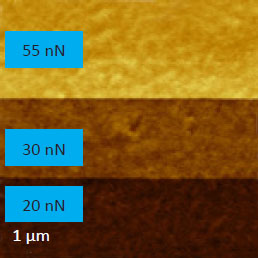
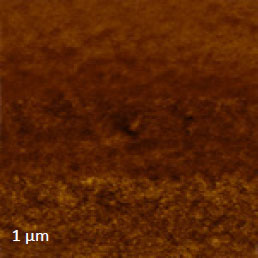
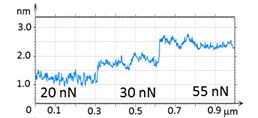
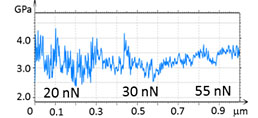
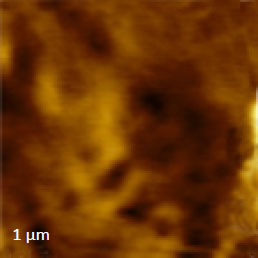
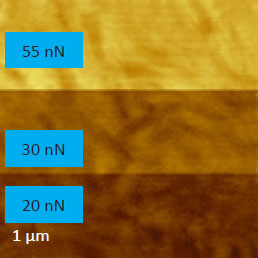
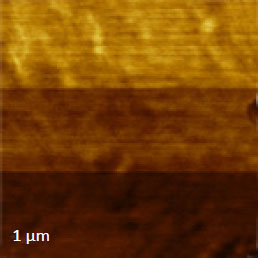
At the initial stage of verification of QNM with HybriD mode we have examined a series of neat polymers, whose elastic modulus spans from tens of MPa to several GPa. These measurements are illustrated by studies of PC and LDPE, Figures 3-4. A scanning of these polymer blocks was made on an area of 1 µm2, and the force level was changed from 20 nN to 55 nN. The height images of PC and LDPE samples reveal the smooth surfaces with corrugations in the range of a few nm.
The deformation and modulus maps are different for these polymers. The elastic modulus of PC does not change as the deformation increases. Its value is in the 3.0-3.5 GPa range that is similar to the modulus obtained in the macroscopic studies [7].
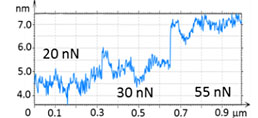
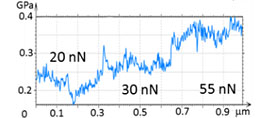
In the case of LDPE, its elastic modulus has increased from 250 MPa to 400 MPa as the sample deformation changed from 5 nm to 10 nm (Figure 4). This result can be explained by the increasing influence of stiff lamellae underlying a top layer, which is enriched in an amorphous material. Both modulus values are in the relatively broad range of macroscopic elastic modulus of this polymer [7].
The differences of the lamellar content and morphology are likely responsible for the variations of the elastic modulus of this polymer.
Elastic Modulus
Elastic Modulus
THE ELASTIC MODULUS MAPPING OF IMMISCIBLE POLYMER BLENDS
Study of the relationship between morphology of multicomponent materials and their performance is an essential issue of modern material characterization. In the last two decades the compositional mapping of heterogeneous polymer materials with AFM was performed with the phase imaging. The latter reveal dissimilarities of the components, which are expressed by variations of the energy dissipated by the probe interacting with these components. Yet the correlation between the phase changes and specific sample properties such as elastic modulus, adhesion, and viscoelasticity is not well established. Even twenty years after the introduction of phase imaging its interpretation remains an unsolved problem. For practical purposes, researchers have used a tabulated relationship between the phase shift and stiffness of the components derived from studies of model systems, in which the ratio of the components has been varied in a systematic way. With the broadening of HybriD mode applications, there is definite progress. We’ll demonstrate the use of elastic modulus mapping for compositional imaging of heterogeneous polymer materials in studies of several PS-containing blends.
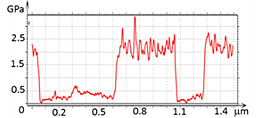
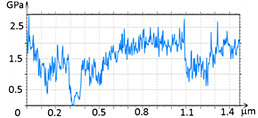
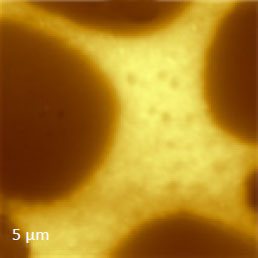
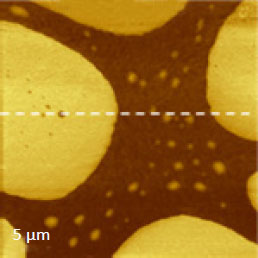
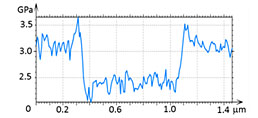
The analysis of the results obtained on the PS/PBd blend showed that the depressed domains embedded into a matrix exhibit a much lower elastic modulus in the map recorded at 6 nN force.
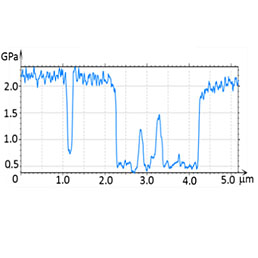
A profile across the domains shows that their modulus is in the range of tens of MPa that is much smaller than the modulus of the matrix (2.5 GPa), Figure 5. These values are close to the macroscopic moduli of PS and PBd [7]. Hence, we assign the domains to PBd and the matrix – to PS.
When the imaging force has been increased 3 times, the elastic modulus map exhibited several changes. The blue-colored profile shows the modulus increase for both domains but the central location of the larger domain. This reflects that an enforcement effect of the underlying matrix happens when the domains are not deep.
In a study of PS/LDPE blend, the height image and the elastic modulus map exhibit a binary morphology, Figure 6. In the modulus profile the depressions and elevations are characterized by the elastic moduli of 2.5 GPa and 0.5 GPa, respectively. A comparison of the obtained modulus values with the macroscopic data for these polymers [7] pointed out that the depressed regions are enriched in PS and the elevations – in LDPE.
Elastic Modulus
As the elastic modulus of the components of the binary blends such as PS/PMMA becomes closer to each other, the modulus-based compositional imaging in HybriD mode becomes more complicated. In some cases the combined AFM/Raman studies might be quite helpful. (For this study we have used a combined NT‑MDT SI Spectra AFM and ThermoFisher DXR Raman™ microscope). The morphology of the examined PS/PMMA blend was characterized by the round-shaped elevated inclusions, which are 50-100 nm higher than the matrix, Figure 7. Simultaneously with this height image we recorded a map of the intensity of the PMMA-related band. This map revealed that the elevated domains are enriched in PMMA and, hence, the matrix is dominated by PS.
At present, a spatial resolution of polymer-specific AFM/Raman imaging is still limited by several hundreds of nanometers.
The developing technologies of tip-enhanced Raman imaging might convert this technique into the chemical analytical tool with a resolution comparable to AFM.
In the study of the same sample with HybriD mode the elastic modulus contrast became distinctive only after the tip-force was raised from 20 nN to 80 nN. The related height image and the elastic modulus maps of 2 mm area are shown in Figure 8. At the high force, the elastic modulus profile shows that the elevated domains exhibit modulus of 2.5 GPa and the matrix - 3.0 GPa. The obtained values of PS and PMMA moduli are consistent with the ranges of the macroscopic modulus of these polymers, which show that PS is typically harder than PMMA. Note that in our samples of the PS/PMMA blend and PS-b-PMMA the molecular weight of PS and PMMA was ~100K.
Elastic Modulus
HIGH-RESOLUTION MAPPING OF THE ELASTIC MODULUS
A tip apex of the majority of AFM probes has a diameter in the 10-20 nm range and a similar spatial resolution is expected for local mechanical measurements. Common polymer structures of a similar size are lamellae of semi-crystalline polymers and block copolymers. In semi-crystalline polymers a lamellar width (10-40 nm) is defined by a length of the extended part of the macromolecular chain in folded conformation. Typically, the lamellar length is higher than the width, and these parameters are varied dependent on chemical structure, molecular weight and crystallization conditions. In block copolymers, in which two chemically different blocks are covalently linked into one macromolecule, the lamellar width (typically in the 10-90 nm range) is defined by molecular weight of the constituents, and the morphology depends on the conditions of micro-phase separation, which is defined by the sample preparation.
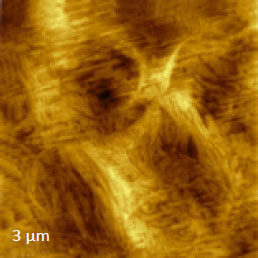
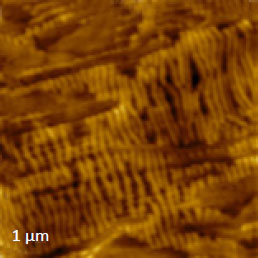
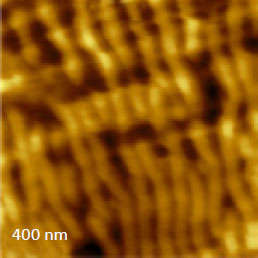
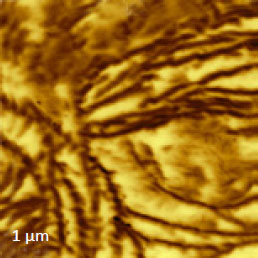
The QNM studies with the nanometer-scale resolution were performed on two neat polyethylene samples: hot-pressed blocks of HDPE and LLDPE. These polymers exhibit different crystallinity due to different content of chain branching that restricts the chain folding. The surface of the HDPE sample is enriched in lamellar structures as seen in the height images, which were obtained in the AM and HybriD modes on 3 µm and 1 µm areas, Figure 9.
a) Height
b) Height
The ordered assemblies of lamellae, which are 20-30 nm wide, cover this surface. The lamellar structures are well distinguished in the height image obtained in the HybriD mode due to a stronger tip depression of the amorphous interlamellar regions in the imaging with 40 nN force.
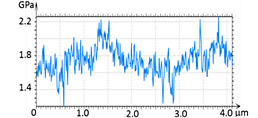
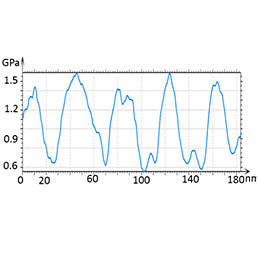
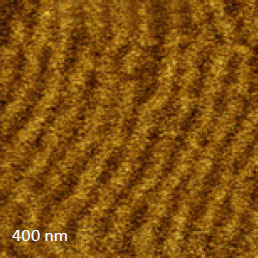
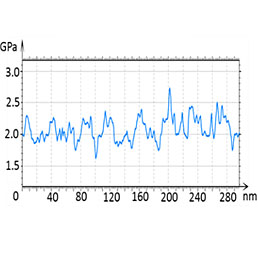
After further reduction of a scanning area to 400 nm (Figure 10), the height image shows that the lamellar structures are slightly disturbed yet the elastic modulus map exhibits the contrast variations on the individual lamellae of approx. 20 nm in width and interlamellar amorphous regions. A modulus profile along several lamellae shows that it is varied between 1.5 GPa on the lamellae and 0.5 GPa in between.
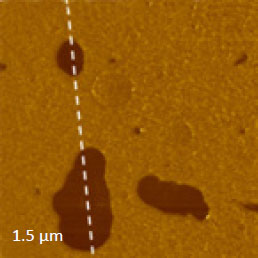
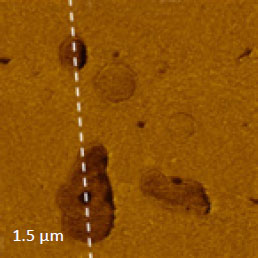
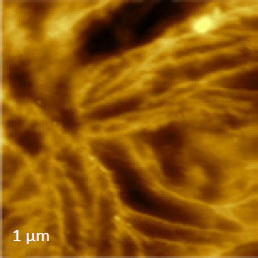
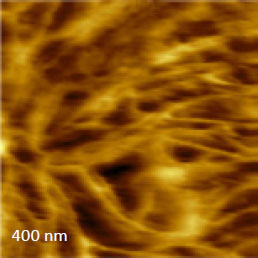
Surface morphology of the LLDPE block is characterized by a smaller amount of lamellar structures, which are more curved and elongated compared to those in the HDPE sample. The height and phase images in Figure 11 illustrate this statement. The stiffer lamellae are best resolved as dark elongated structures, which are 30-40 nm wide, in the phase image. According to the NT‑MDT SI phase convention, the darker features in the high-force phase images correspond to stiffer locations.
This semi-empirical assignment is consistent with the results of the elastic modulus mapping in HybriD mode. The imaging of the same area in HybriD mode at the tip-force of 40 nN reveals a large number of the lamellar structures compared to the AM images.
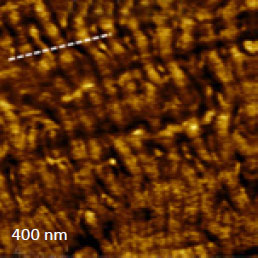
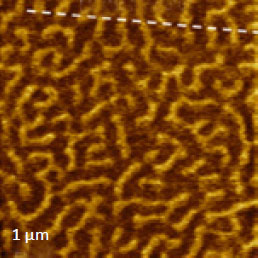
Elastic Modulus
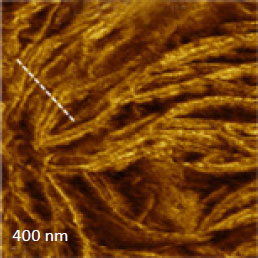
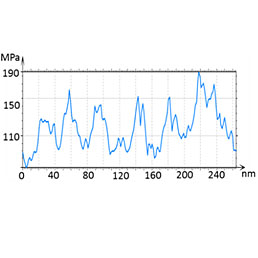
In HybriD mode the tip penetrates deeper into the sample through the amorphous polymer, which enriches the surface layer.
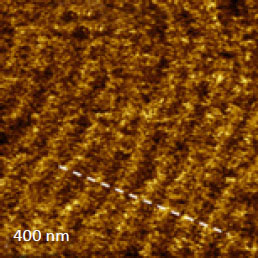
The lamellar structures are well distinguished in the elastic modulus map, and the profile taken along several lamellae along a white dashed line shows the modulus variations with a spatial resolution of 20 nm, which is comparable to the lamellar width. The modulus values (up to 200 MPa) are lower than in the case of the HDPE sample that is consistent with the differences of macroscopic moduli of these polymers. The micro-phase separation of block copolymers is well distinguished in the height and phase images, which are recorded in AM mode at a relatively high force level.
The phase contrast, which is dissimilar on the blocks of a different chemical nature, is not well understood, and this does not allow an explicit assignment of the image features to the material constituents.
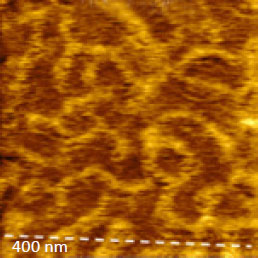
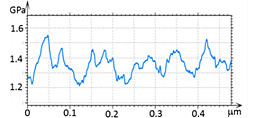
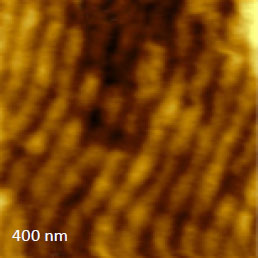
The situation is definitely improved with the help of the elastic modulus mapping in HybriD mode. The height image and modulus maps of the PS-b-PMMA film at 1 µm and 400 nm areas (Figure 13) reveal a typical micro-phase separation pattern.
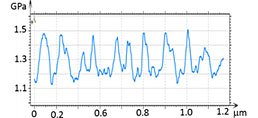
The modulus profiles taken in the maps demonstrate the spatial variations with a repeat distance of 50 nm – the periodicity of the micro-phase separation. The modulus varies between 1.5 GPa and 1.2 GPa. The fact that macroscopic modulus of PS is higher than that of PMMA allows assigning the brighter areas in the modulus map to the PS blocks. Another block copolymer that we looked at was triblock copolymer PS-b-PBd-b-PS, which has been prepared as a film on Si substrate. The sample was also annealed at high temperature, and this led to extended lamellar morphology, Figure 14. In addition to the height image, a micro-phase separation is observed in the elastic modulus maps and profiles.
The elastic modulus variations in the 1.7 GPa – 2.4 GPa range follow the morphology. The high modulus features can be assigned to PS blocks. In the above examples the modulus profiles follow the nm-scale phase separation with the spatial resolution approaching 10 nm.
CONCLUSIONS
The presented data of the QNM mapping in HybriD mode show that the local elastic modulus of most polymers matches their macroscopic analogs.
This justifies the use of the elastic modulus mapping for compositional imaging of multi-component polymers that was demonstrated on immiscible polymer blends. The elastic modulus mapping of polymer lamellar structures reveals the modulus variations with spatial resolution of 20 nm comparable with the tip apex size. This encourages us to apply similar approach to polymers in confined geometries, which are not accessible by other mechanical methods. The viscoelastic behavior of polymers is the further subject of our research with HybriD mode.
REFERENCE
[1] A. L. Weisenhorn, P. K. Hansma, T. R. Albrecht, and C. F. Quate “Forces in atomic force microscopy in air and water” Appl. Phys. Lett. 54 (1989) p.2651.
[2] N. A. Burnham and R. J. Colton “Measuring the nanomechanical properties and surface forces of materials using an atomic force microscope” J. Vac. Sci. Technol. A7 (1989) p. 2906.
[3] S. Belikov et al “Tip-sample forces in atomic force microscopy: Interplay between theory and experiment” MRS Proceedings (2013) p.1527. mrsf12-1527-uu02-042.
[4] J. E. Sader, J. W. M. Chon, and P. Mulvaney “Calibration of rectangular atomic force microscope cantilevers” Rev. Sci. Instrum. 70 (1999) p. 3967
[5] D. Maugis D “Contact, adhesion and rupture of elastic solid” (2000) Springer, Heidelberg.
[6] S. Belikov et al “Theoretical modelling and implementation of elastic modulus measurement at the nanoscale using atomic force microscope” Journal of Physics: Conference Series 61 (2007) 1303.
[7] J. Wen “Some mechanical properties of typical polymer-based composites”” in “Physical Properties of Polymers”, ed. J. Mark (2007) p. 487.